Exercises
In a factory, packs of sugar of 1kg each are filled mechanically. According to European norms no more than 2.5% of the packs of sugar are allowed to contain less than gram. You can download a file with the weights of packs of sugar using this link: sugar bags.
Make a histogram of the weights of the packs. Use classes with a width of gram. Show that the distributions of weights generated by the machine is approximately a symmetric bell-shaped distribution.
Calculate the mean and the standard deviation of the weights, rounded to one decimal.
What percentage of sugar packs is lighter than gram according to this histogram?
The histogram can be approximated by a normal distribution with the mean and standard deviation you just calculated. What percentage of the sugar packs is lighter than gram according to this normal distribution?
What percentage of weights should lie above gram according to the normal distribution?
What percentage of weights deviates from the mean by less than one standard deviation, according to the normal distribution?
For two types of light bulbs, the average lifespan has been determined using a sample of lamps of each type. The number of hours that the light bulbs burn appears to be distributed normally. Here you see the corresponding normal curves. A few percentages are shown.
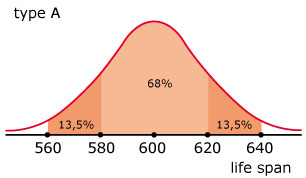
Bulbs of type A have a mean lifespan of hours, with a standard deviation of hours.
What percentage of the light bulbs of type A burns for less than hours?
What percentage of the light bulbs of type A burns for less than hours?
For type A you see that 68% of all lifespans lie between and . This percentage is the same for all normal distributions because the shape of the normal curve is entirely determined by the standard deviation.
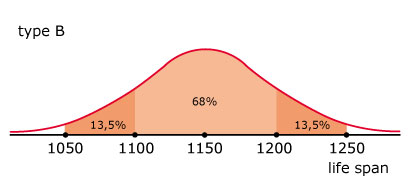
What therefore is the standard deviation of the lifespan of the light bulbs of type B? And what is the average lifespan of the light bulbs of type B?
Why is the peak of the normal distribution of type B lower than that of type A?
What percentage of light bulbs of type B burns for longer than hours?
The length of women is approximately normally distributed. In 1995 the average length of women in the Netherlands was cm with a standard deviation of cm.
Draw a normal curve for this distribution, indicating the mean and the standard deviation.
What percentage of women in that year had a length between and cm?
What percentage of women was probably smaller than cm?
What percentage of women was probably smaller than cm?
What is the chance that any given woman in 1995 was taller than cm?
Here you see two normal distributions.
For each normal curve, determine the values of and .
Determine the percentage corresponding to the shaded area in each graph.
A supermarket sells split peas in packs of g. Some customers suspect that at least a third of the packs contain less than the indicated weight. They submit a complaint to the management of the supermarket. A consumer organisation is asked to investigate the matter. They take a sample of packs. The average weight of the packs turns out to be g with a standard distribution of g. The weights of the packs appear to be normally distributed.
Draw a bell curve for the distribution of the weights of the packs of split peas.
What percentage of packs in the sample was more than one standard deviation different from the mean?
What percentage of packs in the sample had a weight of less than g?
Can you determine precisely what percentage of packs had a weight of less than g?
Make an estimate of what percentage of packs weighs less than g. Was the complaint of the customers justified?
One measure for a person's intelligence is the IQ (intelligence quotient) - the score on an intelligence test compared to the average score of people of the same age. The IQ is normally distributed with a mean of and a standard deviation of .
What percentage of people has an IQ between and ?
What percentage of people has an IQ higher than ?
What is the chance that the IQ of a random passer-by is less than ?
How low does your IQ need to be to put you in the 16% of people with the lowest scores?
Test scores have been collected for two age groups. The scores of both groups are roughly normally distributed. The table below shows the mean and standard deviation of each group.
| 12 year olds | 16 year olds | |
| number of tests | 500 | 800 |
| µ | 48 | 56 |
| σ | 8 | 12 |
Between which values will you find 95% of the scores of the 12-year olds?
Between which values will you find 95% of the scores of the 16-year olds?
What is the chance that a 12-year old scores higher than the average 16-year old on the test?